Measuring Our API Performance: A Journey from Guesswork to Reliable Insights
At some point, every engineering team realizes they can’t fix what they can’t measure. That’s where we were when we started this: we wanted to measure our API performance reliably. The key word here is reliably. We didn’t want ballpark estimates or sporadic logs. We wanted proper observability—something we could track over time, visualize, and base decisions on.
The Simple Setup That Worked (at First)
Our first move was obvious: use Prometheus to scrape standard API metrics and visualize them with Grafana. Our API was already exposing the usual /metrics endpoint using libraries like prometheus-net or prom-client, depending on the language.
A docker setup away, we got Prometheus running on my home server
The result was this:
http_request_duration_seconds_bucket{le="0.5",method="GET",route="/api/products",status_code="200"} 143
http_request_duration_seconds_bucket{le="1",method="GET",route="/api/products",status_code="200"} 144
http_request_duration_seconds_sum{method="GET",route="/api/products",status_code="200"} 170.05
http_request_duration_seconds_count{method="GET",route="/api/products",status_code="200"} 89
What are we looking at? These are Prometheus histogram buckets, and they count how many requests landed within specific duration buckets.
If you define buckets like 0.1, 0.5, 1, 2, 5, then a request that took 0.3 seconds would increment the bucket for 0.5. You don’t get exact durations, but you get ranges, which is perfectly fine for building percentile metrics (p-metrics).
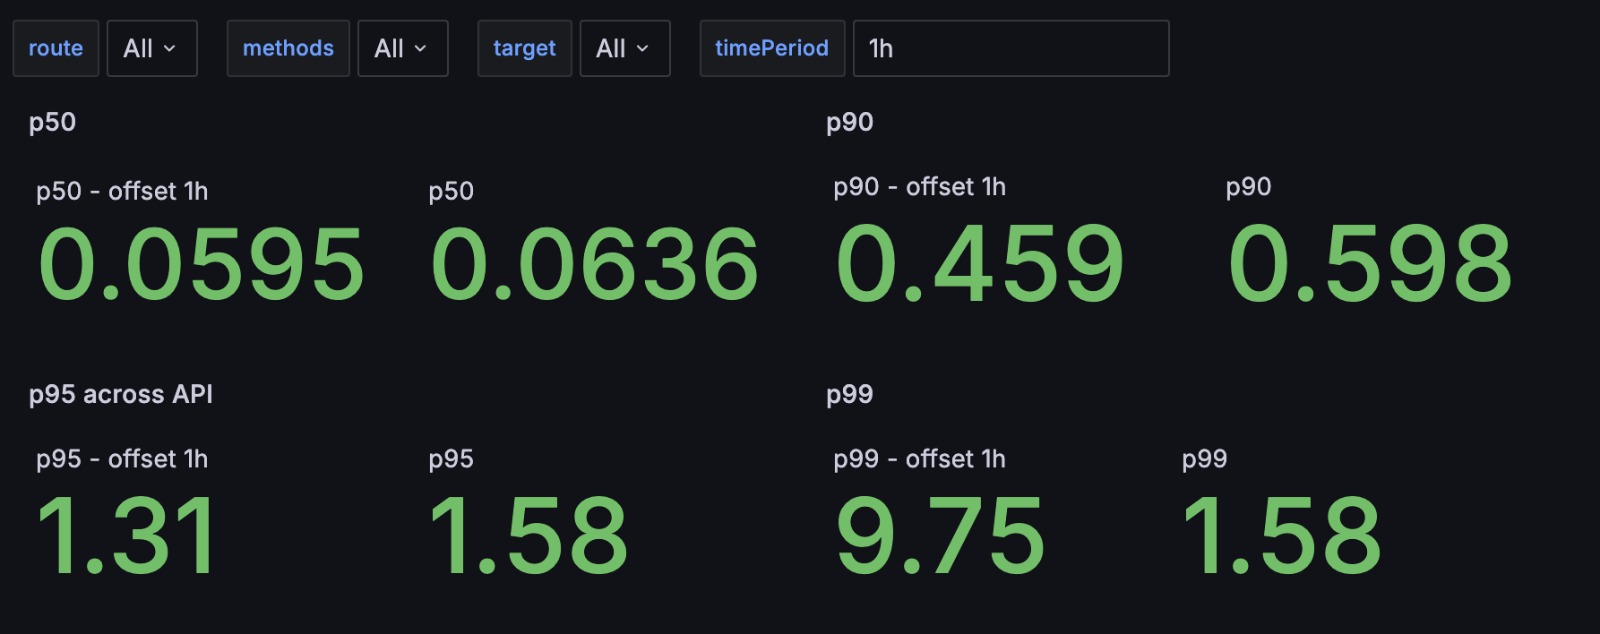
Enter: P-Metrics
Using PromQL, we could now compute percentiles like p50, p90, p95, and p99. Here’s an example query:
histogram_quantile(0.95, sum(rate(http_request_duration_seconds_bucket[5m])) by (le, route))
P-metrics often trip people up. For instance:
- p50 = 50% of requests were faster than this value (i.e., median).
- p90 = 90% of requests were faster → so 10% were slower.
- p99 = The slowest 1% of requests.
So when your p99 is bad, it’s highlighting outliers—possibly heavy tenants or edge cases.
We tracked p-metrics day over day, month over month. They helped us spot regressions and improvements after deployments or infra changes.
Scaling Up: Where It Broke
Soon we hit a snag: Prometheus showed strange cardinality errors, and our data was unreliable.
The problem? Multiple ECS tasks running our API. Prometheus would scrape /metrics on one of them, randomly. No sticky routing = partial or inconsistent data.
Fix: Prometheus Service Discovery
We configured OpenTofu (Terraform alternative) to enable Prometheus EC2 task discovery, so Prom could find and scrape all API instances individually.
This worked! But it came with a downside: our historical data was inconsistent and had to be discarded. From that point, we finally had a full picture.
Cold Data, Hot Headaches
Prometheus doesn’t like long-range queries. It stores recent data in RAM (hot data), while older data becomes “cold” on disk. Querying cold data is expensive.
To keep querying efficient for things like monthly p95s, we added recording rules. These let Prometheus precompute expensive metrics and store them.
Here’s a sample recording rule YAML:
groups:
  - name: api-request-latency
    interval: 1m
    rules:
      - record: api:p95_request_duration_seconds
        expr: histogram_quantile(0.95, sum(rate(http_request_duration_seconds_bucket[5m])) by (le, route, method))
This meant our p95s were ready-to-query, even for old data. Tradeoff: more disk usage—but CPU/RAM savings were worth it.
It Wasn’t Enough: Tenants Made It Worse
Even with better metrics, our p95 and p99 numbers were volatile. Why? Our customers aren’t equal.
Some tenants had 3x more data or highly fragmented domains, and those requests skewed the global metrics badly.
Solution: Per-Tenant Metrics
We added tenantId as a label to our Prometheus metrics:
http_request_duration_seconds_bucket{route="/api/products",tenant_id="acme-corp",method="GET",le="1"} 53
Now we could visualize p95 per tenant—and that was a game-changer.
CPU Spikes: The Dark Side of High Cardinality
The problem? Too many tenants + endpoints = high cardinality.
Every time Prometheus scraped /metrics, the API had to compute thousands of metric combinations. This led to CPU spikes and instability. Not worth the cost.
Future Plan: Push, Don’t Pull
The long-term fix is to flip the model: instead of Prometheus scraping the API, the API will push metrics to Prometheus via remote write.
Benefits:
- No more scraping overhead.
- No need for auto-discovery for the API.
- We control when to flush and reset metrics.
Why is that last part important? Our API tasks are long-running. Metrics grow over time (counters, histograms, etc.). Without flushing, metrics become bloated.
In a scrape model, flushing on demand is unreliable—scrape timing is out of your hands. But when pushing, we can flush right before the push.
Conclusion
This journey taught us that measuring API performance isn’t just about enabling /metrics. If you want reliable and actionable metrics, you need to:
- Track percentiles, not just averages.
- Record metrics per tenant if needed.
- Use recording rules for scalability.
- Switch to push model if cardinality explodes.
We’re still evolving our observability stack—but we now have clarity on what’s slow, what’s normal, and where we need to optimize.